

How Stocks are Valued
How market valuations arise from earnings multiples.

In 1602, the States General of the United Netherlands formed Vereengde Oost-Indische Compagnie, or The Dutch East India Co., often referred to just as VOC. Thought to be the first company to allow the public to invest in its business, the idea was to fund expensive trade expeditions by relying on many small private investors as opposed to a single, large investor, such as a monarch. This was a novel idea at the time, and it took off like wildfire. The VOC enjoyed a 20-year monopoly on trade with the East Indies and generated massive returns for most of its investors. This did not come without risk, of course. Sometimes, ships sank or simply went missing. Other times, things went without a hitch for long periods of time and demand for its shares on the Amsterdam Stock Exchange, founded alongside the VOC, became irrationally high. In 1637 at the peak of “Tulipmania”, the company was valued at over 78 million Dutch guilders which roughly converts to $862B in silver American Eagle coins today. As competition crept in and the company stagnated, operations ultimately ceased in the late 1700s. But from the mid-1600s to around 1772, the company paid an annual dividend between 12% to 40% to its shareholders. With a dividend like this, it’s easy to see why someone would want to invest, and therefore why its shares held value.

The price of a stock is determined solely by the demand for the company on the open market. It’s worth what the highest bidder is willing to pay for it at any given time. The best way to think of it is as a perpetual auction in which everyone is both an auctioneer and potential bidder. The value up for auction is the future cash flows of the business for sale. In comes in the Price to Earnings ratio, which is often referred to as the multiple. Most investors today have heard of the rule of 72, which helps us easily gauge how long it would take for our money to double given a fixed rate of return. Using 9%, for example, the rule gives us a result of 8 years (72/9=8). The P/E ratio works in a similar way where P equals the price of the stock and E equals the earnings per share (in the case of a forward P/E, E equals estimated earnings per share). The result can be interpreted as the number of years of similar earnings it would take to double your investment.

Now, this comparison isn’t apples to apples and my intent isn’t to suggest that the P/E ratio directly translates into how long it will take for your stock investment to pan out. It is simply a static valuation measure. In fact, it accounts poorly for corporate capital allocation decisions that could impact future earnings. However, P/E measurements over time can provide valuable insight given the correlation between earnings and stock price. To this I say, “no duh”. The whole reason we invest in the first place is to make money, and the primary means by which corporations provide return to shareholders is through allocations of earnings. Over the past 25 years, the 500 largest US publicly trades companies have averaged a P/E ratio of 16.8. This market derived average tells us that this generation of investors is willing to accept a current stream of cash flows that would provide a doubling effect over 16.8 years. In nominal terms, using the rule of 72, this means a 4.3% annual positive cash flow is expected. Now, stocks also trade with a “hope” premium. Meaning that investors “hope” earnings grow through good capital allocation decisions. This “hope” premium fluctuates over time and varies wildly from company to company. Shorter-term minded investors should pay close attention to it due to its fickle nature. High levels of hop are reflected in a higher P/E ratio. The higher the ratio, the more hope.

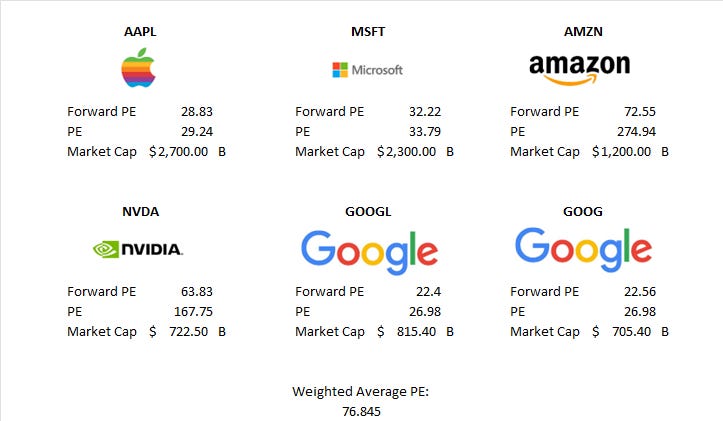
Today, we are seeing massive hope premiums priced into the largest US companies. Look at the top six names in the S&P 500 which represents more than 23% of the index, illustrated in the chart below. Combined the average P/E is a whopping 76.84 as of the prices at the time of this writing on 05/17/2023. Now, I maintain a generally optimistic outlook, but this is approaching absurdity. The fact that inflated valuations seem to be occurring mostly in large cap US equities is telling, and we will investigate this more next week. With investors now able to find positive real yields in fixed investments, the prospect of a recession looming large, and with historical precedent justifying lower multiples, the short-term outlook for the largest US equities seems dubious. When it comes to investing, it’s all about the cash flows and there are too many headwinds to expect windfalls here, all hype around Chat GPT aside. Time will tell whether investor hope is appropriately placed, but I believe the prudent investor should approach this market cautiously.
The opinions voiced in this material are for general information only and are not intended to provide specific advice or recommendations for any individual.
All performance referenced is historical and is no guarantee of future results. All indices are unmanaged and may not be invested into directly. Any company names noted herein are for educational purposes only and not an indication of trading intent or a solicitation of their products or services. LPL Financial doesn’t provide research on individual equities. Dividend payments are not guaranteed and may be reduced or eliminated at any time by the company. All investing involves risk including loss of principal. No strategy assures success or protects against loss.
Securities offered through LPL Financial LLC. Member FINRA/SIPC. Advisory Services offered by National Wealth Management Group LLC, an SEC Registered Investment Advisory and separate entity from LPL Financial LLC.