
Sell in May, Go Astray
Is market seasonality a thing?

For those paying attention, you may already know that the FOMC convened this week for its seventh meeting of 2024, concluding with a Tony Robbin’s sized yawn. No changes except for a minor adjustment to the notoriously unreliable dot plot. The traders are furious and have rallied behind their socials to salvage sensation from a sea of boring. Anything to justify a lopsided, leveraged position.

All this chatter reminded me of the adage “sell in May, go away”. The phrase was popularized by the Investors Almanac in the 1950s when a researcher discovered a pattern market of weakness during the summer months. The idea was to use this historical observation to improve future risk adjusted returns. This eventually devolved into a market timing strategy.
It’s human nature to pine for competitive advantage. We’re so desperate for one that we often demonstrate willingness to suffer collateral damage to sabotage our competition. The ends justify the means, we tell ourselves. We will even invent facts out of thin air and discover meaning in otherwise meaningless patterns, sometimes with hilarious results.

Think for a moment, given the infinite variability of life, any analysis of the averages will inevitably lead to some degree of kurtosis. If it were not “sell in May go away”, it could have just as easily been “Sell in December, best remember”. I’ve never liked the idea of using blunt historical patterns to predict the future with precision.
In fact, the Sell in May, go away strategy has not been as fruitful for investors who would have been better off simply buying and holding. The data below, taken from Y Charts, shows the average monthly returns of the S&P 500 since 1950.
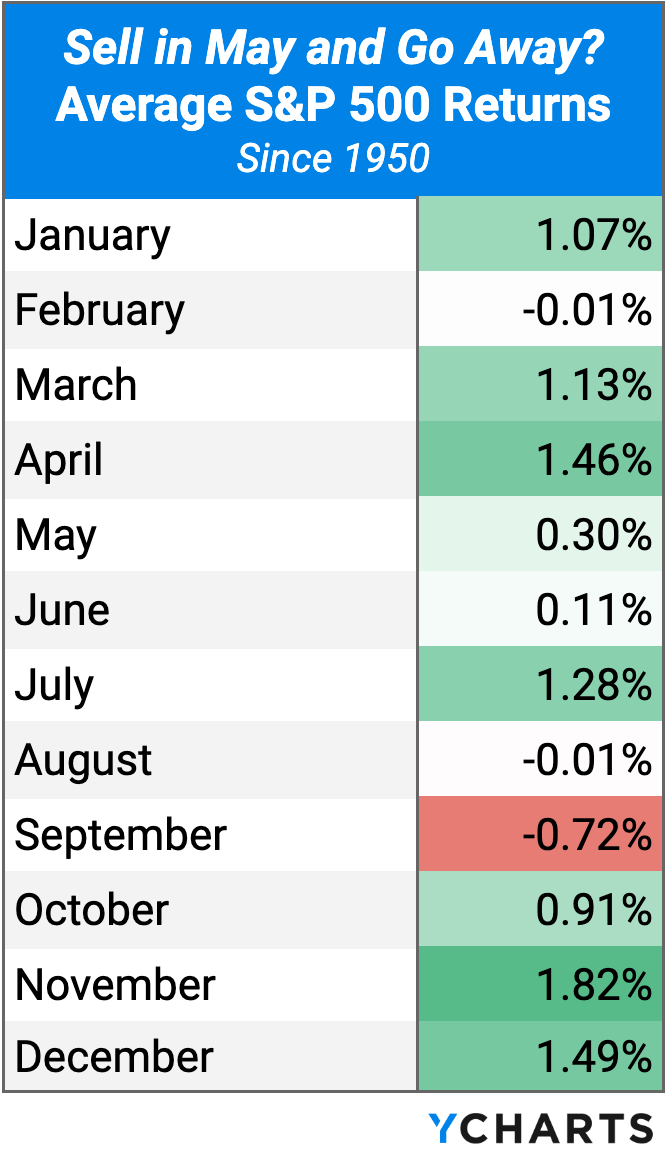
Any commonsense investor can see how sitting out the months of May through October can wreck your returns. It’s not much different than spending $100 to save $50.
Let’s take a closer look at the data point in red. Red = worry (patterns!). The only reason September has been the worst month over the 50-yr average is because it happens to be the unlucky victim of poor timing. It is the only month to be fully represented in many of the most brutal sell-offs the past 50 years including all three years of the dot-com bust:
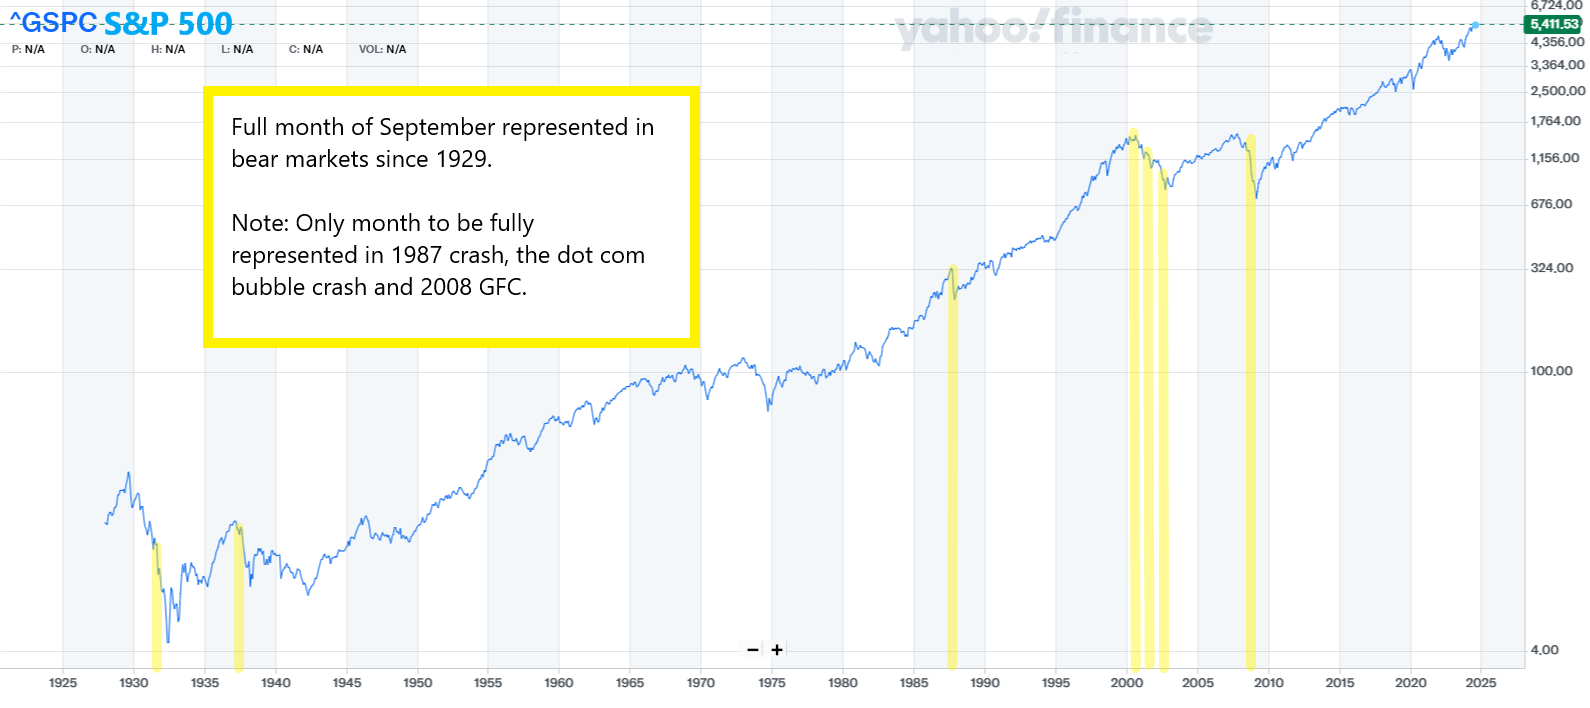
Does this mean we should avoid the month of September moving forward? Well, if you took that advice post GFC, you would have missed out on a chunk of market rallies, including those that took place in 2020 and 2022.
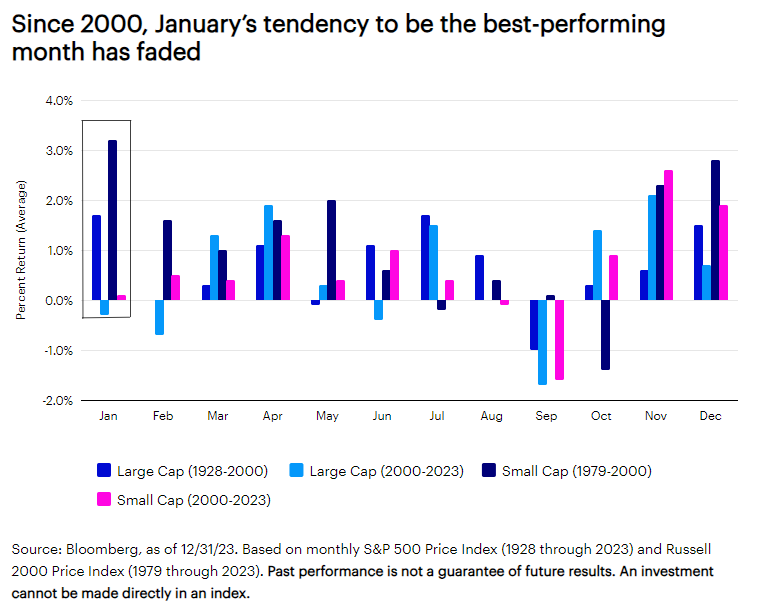
Ok, now that we have dispelled the sell in May, go away myth, let’s look at another lesser-known seasonal effect known as the January Effect. The January Effect refers to the statistical anomaly that a positive stock market in January largely predicts how the rest of the year will go.
This theory stems from research that a positive market in January is coupled with a positive remaining 11 months 77% of the time since 1928[1]. Never mind the inconvenient fact that the market is positive 2/3rds (67%) of the time and a negative January only corresponds with a negative calendar year 54% of the time[2].
While this statistical correlation does turn up an eyebrow of curiosity, the effect has waned in the last two decades. So, if there was at one time a competitive edge to be garnered with this information, it has long since been diluted into irrelevance.
Before the ubiquitous use of electronic trading, automated investment plans and passive index investing, the January effect was statistically significant. Active trading used to dominate the scenes and many portfolio managers would coordinate trade strategies with the calendar year-end for tax and window dressing purposes – a possible explanation for the phenomenon.
This still goes on today, however the market impact doesn’t appear to be meaningful enough to use.
So, there we have it. Pay no attention to market seasonality. The best approach has been, and continues to be, a sensible asset allocation you can remain committed to over long-term market cycles.
Instead of trying to read the tea leaves, try steeping them in a pot of hot water. Pour the contents into a mug and sit back in your favorite lounging area. Then benignly ignore your properly allocated portfolio. That’s all you can do and all you should do.
[1] Bloomberg, 12/31/23. Based on monthly S&P 500 Price Index data from 1928 to 2024.
[2] Bloomberg, 12/31/23. Based on monthly S&P 500 Price Index data from 1928 to 2024.
The opinions voiced in this material are for general information only and are not intended to provide specific advice or recommendations for any individual.
All performance referenced is historical and is no guarantee of future results. All indices are unmanaged and may not be invested into directly.
Securities offered through LPL Financial LLC. Member FINRA/SIPC. Advisory Services offered by National Wealth Management Group LLC, an SEC Registered Investment Advisory and separate entity from LPL Financial.