
What Shrinks and Grows at the Same Time?
The shifting economics of the housing market.

Several months ago, in the newsletter titled Everything Down But the House, I suggested that home prices would continue to climb, even as demand declined due to higher mortgage rates. Now, with the current 30-year mortgage rate settling in at around 7%, compared to 3.5% last year, it’s time to pull out the charts and see if this prediction came true. Since I’m not a big fan of shows that drag the suspense along indefinitely without ever seeming to get to the point, I’ll spare you the suffering. Yes, it did come true, and the following charts illustrate some interesting facts about our current housing market.
5-Year Trend for 30-Year Fixed Rate Mortgages

US Listings Since January, 2012

5-Year Trend for Housing Demand

Source: Data collected from RedFin.com, compiled from MLS and/or public records.
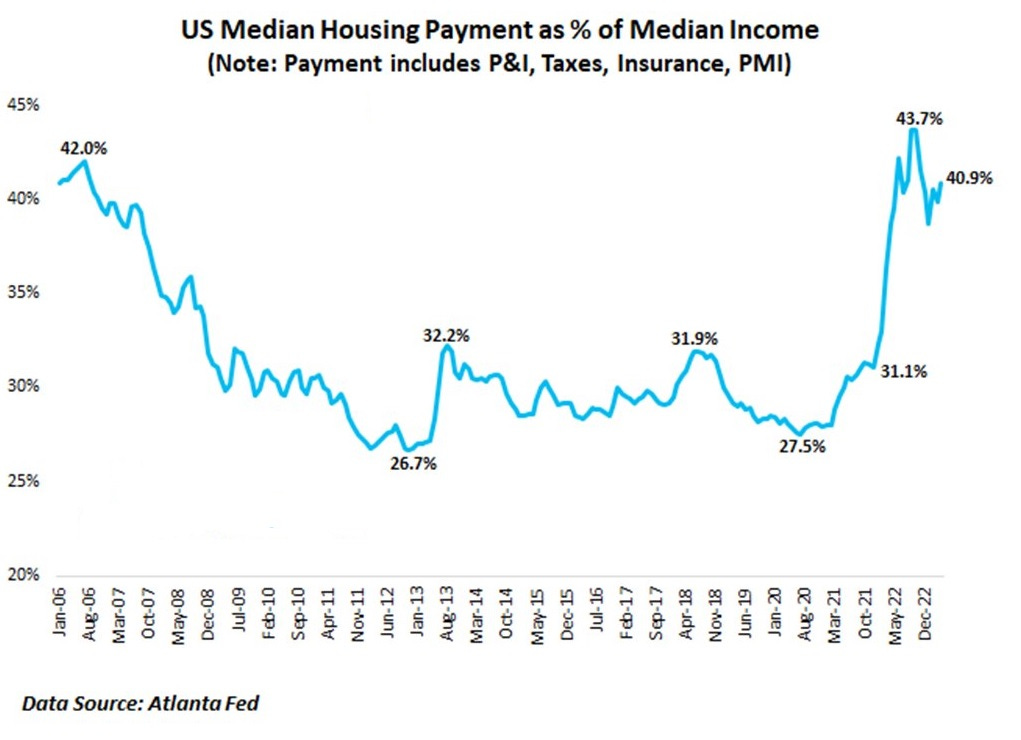
When the Fed began its rate hike campaign in March, 2021, it wasn’t uncommon to come across opinions painting an apocalyptic forecast for the housing market. The notion that home values were doomed to collapse was so prevalent that some even put a hold on buying the home they needed out of fear of bad timing. The 08-09 muscle memory conjured up fears of upside-down mortgages and the associated feeling of financial entrapment. But, this time is different, at least for now. The medium price for a home sold in the US is $418,000, so if we use this as the baseline to compare mortgage payments on a loan for the average home now versus last year, you could assume that demand would fall off a cliff. The difference in mortgage payments would go from $1,877 per month to $2,922 per month, excluding taxes and insurance. In fact, we do see exactly that in the chart above, however prices have only declined at the aggregate about -3.4% nationwide. Furthermore, demand seems to be picking back up as potential buyers stop waiting around for the dip, something else that I predicted.

But now they have a problem: supply. According to RedFin’s data, there are less homes for sale today than in the peak of the COVID-19 lockdowns in 2020. In fact, housing supply is lower today than it has been in decades. This is the major factor providing a floor for the record setting home prices seen in 2022. If there were more supply, the situation could quickly shift to a buyers’ market as sellers would compete for fewer qualified buyers, which often means asking for a lower price. This is not the case, nor will it be the case so long as rates do not go back down to the approximate average rate of the current mortgage. This brings us to our next fun-fact chart:

More than half of the mortgages in the United States are below 4% and nearly 90% below 5%. Who in the right mind is going to sell their home with the deal of the century mortgage rate attached? Homeowners are settling in like barnacles on a beach boulder, with mostly motivated sellers and a handful of home builders providing the supply. This is having major ramifications beyond the obvious plight of potential home buyers. With supply near 50% less than the decade peak, realtors are finding it increasingly difficult to sustain a career as listings become increasingly hard to come by. Home builder stocks are now close to their all-time highs, and home improvement store sales, while off their peak, have remained steady.
Buyers, desperate for cash flow relief, are seeking creative financing solutions to mutate a bad idea into a deal, something that I strongly discourage. While home prices have meaningfully outpaced wage inflation and mortgage rates have doubled, this is not the time to dive headfirst into an overextended balance sheet out of desperation or frustration. As a guideline, always budget for 20% down on a home with the rest financed with a fixed rate mortgage of no longer than 15 years. If the criteria above place the home you want out of your budget, than you probably cannot afford the home. At least not if you want a comfortable level of free cash flow, which can come in handy when the going gets tough. I fear most do not use this simple stress test when shopping for a home which could be setting the stage for the next credit crunch down the road. Another reason to dive into these charts again in the future! It will be interesting to watch how the housing market develops as the habits of homeowners and buyers change in reaction to shifts in interest rates and the stickiness of work-from-home (WFH) preferences. My expectation is for home prices to continue a modest creep forward as these low inventory numbers are unlikely to change anytime soon.
The opinions voiced in this material are for general information only and are not intended to provide specific advice or recommendations for any individual.
Securities offered through LPL Financial LLC. Member FINRA/SIPC. Advisory Services offered by National Wealth Management Group LLC, an SEC Registered Investment Advisory and separate entity from LPL Financial LLC.