
Down a PEG

Value is subjective. We hear the term “intrinsic value” quite often and take for granted its meaning. Never considering the fact that it is a classic oxymoron, similar to “act natural”. Value is derived solely from human experience.
There is nothing intrinsic about it. A lump of gold, no matter how big, floating in the darkness of space is completely worthless. In fact, it may have negative value if its trajectory is on course to hit a manmade spacecraft. Go ahead, claim this lump of gold and sell it to your neighbor. See if I’m wrong.

We recently experienced the subjective nature of value while on vacation in the Caribbean (hence my silence for 2 weeks). My three sons were rough housing in the pool and splashed my wife and daughter one too many times. The wife says, “go buy a ball for them”.
I buy the ball. It’s value at Walmart in a typical US suburb would be at most $3. Next to the pool in this remote location where the shop keep knows convenience comes at a premium, it was $20. And you know what? I would buy it again given the same circumstance.
This ball is the same exact object at both merchants, intrinsically identical. The only difference is the human condition of location and need. The fact that all value is subjective like this presents us with a major challenge when it comes to measuring it.
But try we must and there are no shortages of formulas with ratios to do exactly that when it comes to stocks. The PEG ratio is such a measure. It takes a company’s PE ratio (stock price divided by earnings per share) and divides this by an estimated earnings growth rate over five years. Here’s the formula:
PEG = PE / EGR
Where:
PE = Price / Earnings
EGR = Earnings growth rate over five years
The idea is to find out how investors are valuing the potential earnings growth of a company. A high number means investors value the growth more than that of a company with a lower PEG ratio. Like the ball, not all earnings growth is equal in the stock market even if the cash flows are equal.

Conventionally, a PEG ratio of more than 1 means the position is overvalued whereas anything below 1 is undervalued and should be the better buy1. Unfortunately, one cannot rely on convention for prophecy. The contrarian position is to invest where the crowd is going, not where they are. Predicting the direction of the crowd is the tricky part.
So why are we seeing PEG ratios north of 2, 3, and even 4 in the top 10 S&P 500 names? The weighted average PEG ratio for the 8 largest US stocks that provide guidance on growth estimates is a frothy 2.16!

Believe it or not, these figures were higher last week as I was researching the numbers for this entry. It’s as if the market figured out that I was catching on and wanted to dress up its windows a bit before I published. The original title I thought of was PEG’d to the Sky. Fortunately, there’s a lot you can do with the acronym ‘PEG’.
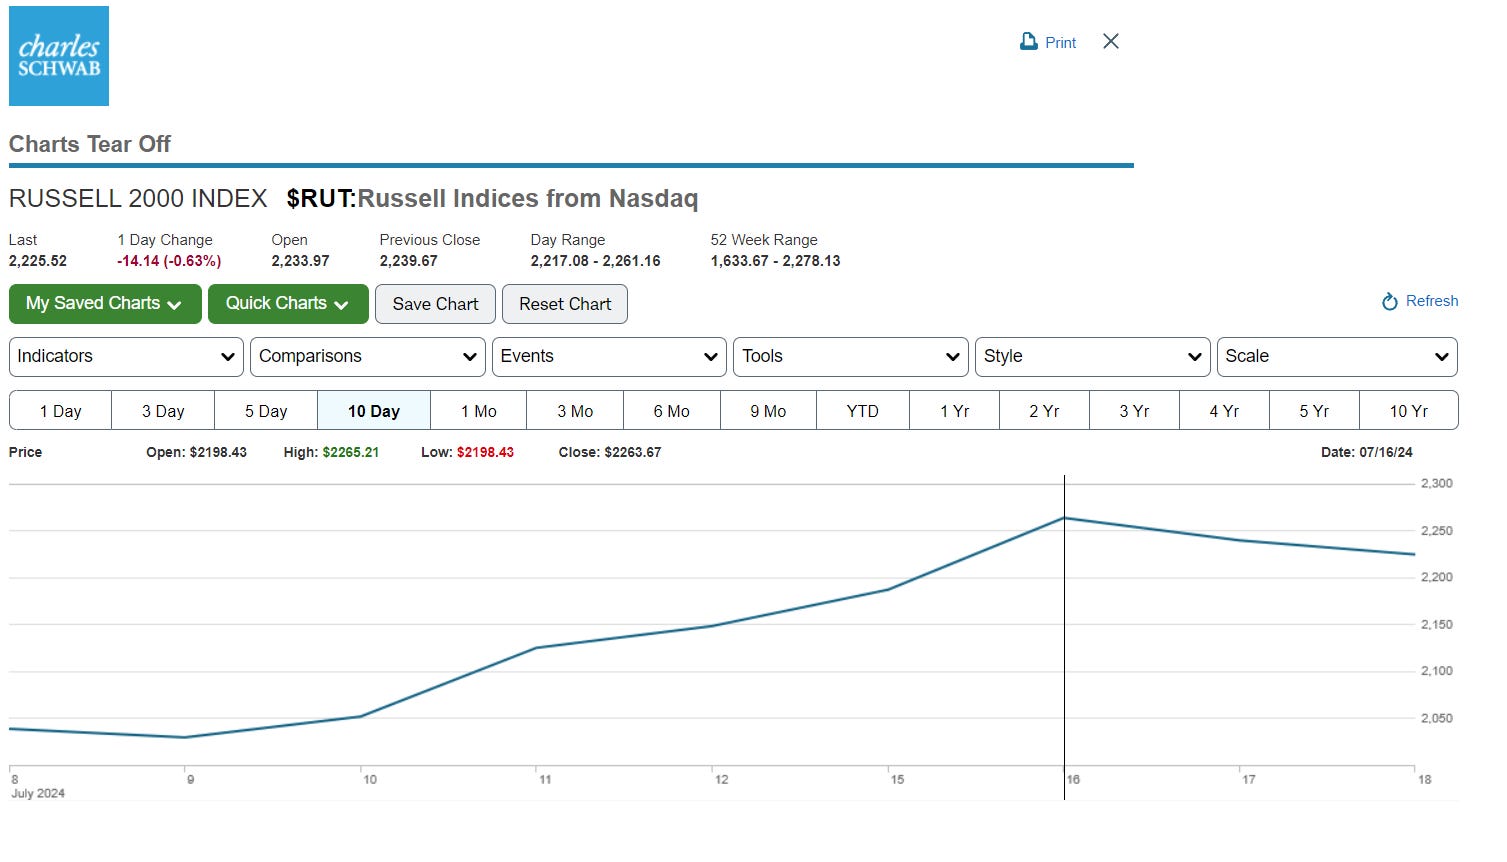
There has been something of a rotation from the high-quality, yet relatively expensive mega-caps to the mid and small-cap companies. Over the past 10 days, the Russell 2000 is up 9.14% while the S&P 500 is down by -0.2%.

Investors have been rewarding the largest US companies that consistently deliver on earnings with valuations well above long-term averages. It’s as if all investors are sitting by the pool in the Caribbean and their significant other looks to them and says, “you need to go buy a stock”.
Which stock? The one that is most convenient, of course. That means either the best performing index funds or the well-known names with trendy growth trajectories. As I said before, convenience comes at a premium.
Perhaps we have reached a tipping point where prices have gone up just a little too much and more effort is exerted to find better value elsewhere. There was a limit to the price on that ball I would be willing to pay – not going to say how much.
Now is a good time to rebalance. If you have been concentrated in US Large Cap equities, pat yourself on the back for your good luck and fortune. But have enough wisdom to acknowledge that valuation gaps matter.
The opinions voiced in this material are for general information only and are not intended to provide specific advice or recommendations for any individual.
Economic forecasts set forth may not develop as predicted and there can be no guarantee that strategies promoted will be successful. All performance referenced is historical and is no guarantee of future results. All indices are unmanaged and may not be invested into directly.
There is no assurance that the techniques and strategies discussed are suitable for all investors or will yield positive outcomes. The purchase of certain securities may be required to effect some of the strategies. Investing involves risks including possible loss of principal.
Please include the following disclosures in a similar font size with a paragraph between for prominence:
The prices of small and mid-cap stocks are generally more volatile than large cap stocks.
Rebalancing a portfolio may cause investors to incur tax liabilities and/or transaction costs and does not assure a profit or protect against a loss.
Securities offered through LPL Financial LLC. Member FINRA/SIPC. Advisory Services offered by National Wealth Management Group LLC, an SEC Registered Investment Advisory and separate entity from LPL Financial LLC.
A negative number means the company is losing money or expected to lose money.